Guide index
User manual
Statistics
Bookings received, occupancy, clients, and outcomes.
Updated November 2026
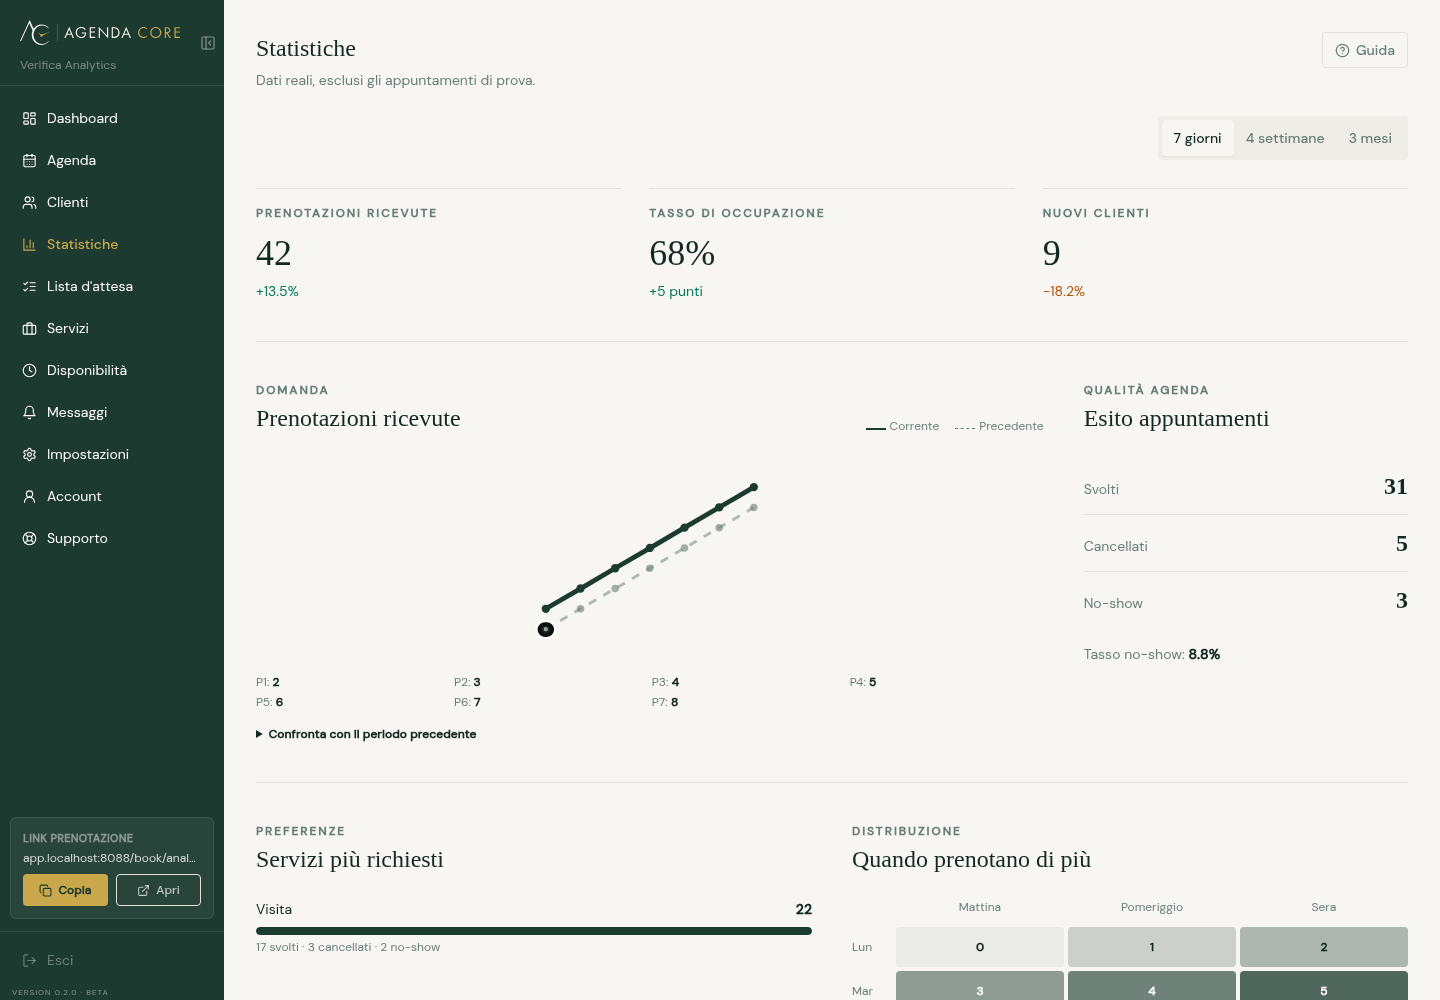
Pick 7 days, 4 weeks, or 3 months to analyze the current period. The deltas next to each indicator compare a previous interval of the same length. Test appointments are excluded.
How to read the data
- Bookings received
- Counts the requests clients created during the period, even when the chosen appointment falls on a later date.
- Occupancy rate
- Compares the time filled by appointments with the time actually available in the period, accounting for availability, exceptions, and blocks.
- New clients
- Counts clients whose first appointment falls in the selected period.
- Bookings received: chart
- Shows when clients sent each request. The dashed line represents the previous period.
- Most requested services
- Ranks services by appointments booked in the period and summarizes outcomes, cancellations, and no-shows.
- When clients book most
- Shows where appointments sit in your calendar, based on their start time: not the time the client made the booking.
| Band | Appointment start time |
|---|---|
| Morning | 05:00–11:59 |
| Afternoon | 12:00–18:59 |
| Evening | 19:00–04:59 |
Services and time distribution appear after at least five real appointments in the period.
Period and comparison
- Choose 7 days, 4 weeks, or 3 months. Charts and KPIs update for that period and compare the previous one.
- Test data is excluded. Bookings received and trend use request creation; demand by service and day/time uses appointment start.
KPIs, outcomes, services, and time bands
- Read Bookings received, Occupancy rate, and New clients alongside the previous-period comparison.
- Trend shows current and previous requests; Outcomes separates states such as confirmations, cancellations, and no-shows. Most requested services and busiest times help assess duration and availability.
- A change with no prior baseline may lack a meaningful percentage comparison. Check dates and time basis before comparing panels.
First period, errors, and access gate
- Statistics is included in Free and Core. Placeholders appear during loading.
- With no real appointments in the first period change the interval or open Calendar; individual charts may be empty even when others have data.
- For Cannot load statistics select Retry. If Discover plans appears unexpectedly, check subscription loading and contact Support: that view also appears when plan data does not arrive.